
December 15, 2025

Finance teams, accountants and founders can create a comprehensive financial health check by importing financial and non-financial business data into reporting software like Fathom. You could also use spreadsheets that have been custom built, although your results may not be as detailed, timely, or easy to interrogate.
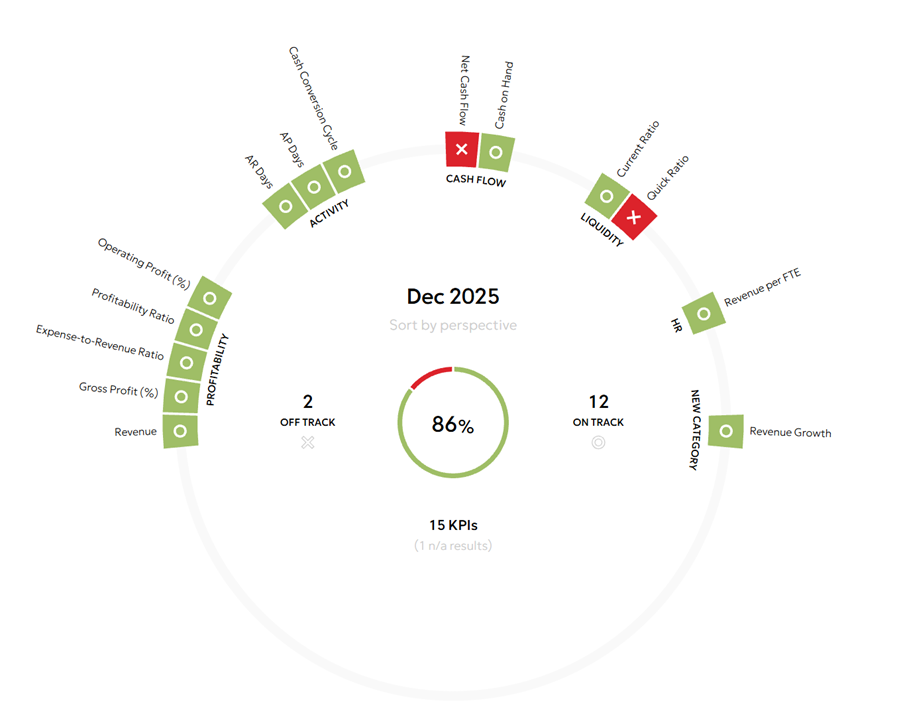
A financial health check is a performance report that combines financial and non-financial data to demonstrate the quality of 3 critical business elements:
A financial health check leverages 4 core principles to deliver business insight:
A financial health check is a key diagnostic and decision-making tool for a business. A high-quality report will enable you to:
“Businesses are not about the numbers; they are about the people. But the numbers are what make or break success. I recommend financial health checks for any business looking to grow beyond the survival level. And, in my view, Fathom offers the best capability of any reporting software on the market.”
The minimum data required are:
You will need to include a diverse range of metrics that help indicate the financial health of the business.
Here are some examples of common financial health check metrics.
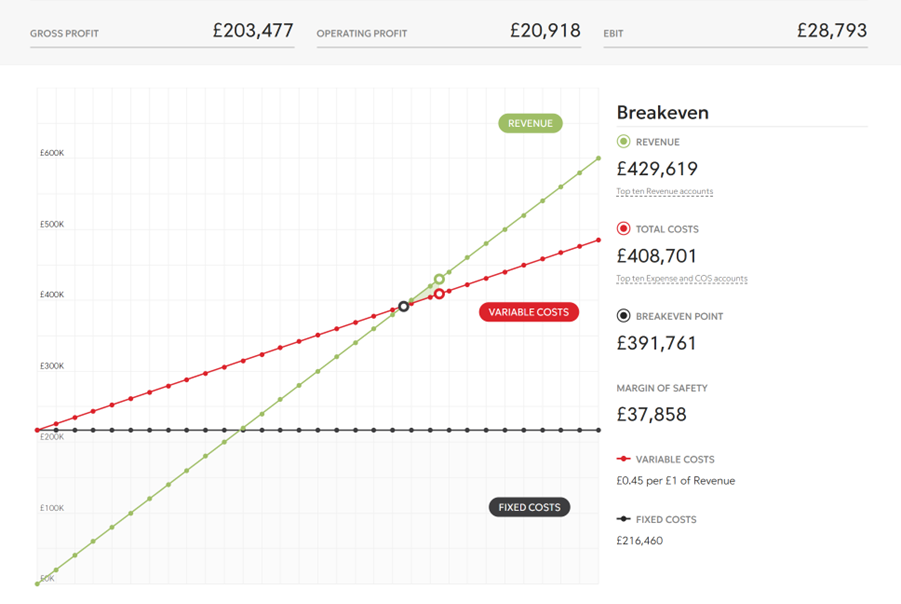
Put very simply, profitability metrics reveal how much income the company has left after accounting for expenditure. There are many different ways to look at this, but some meaningful profitability metrics include:
Learn about Fathom’s profitability tool ->
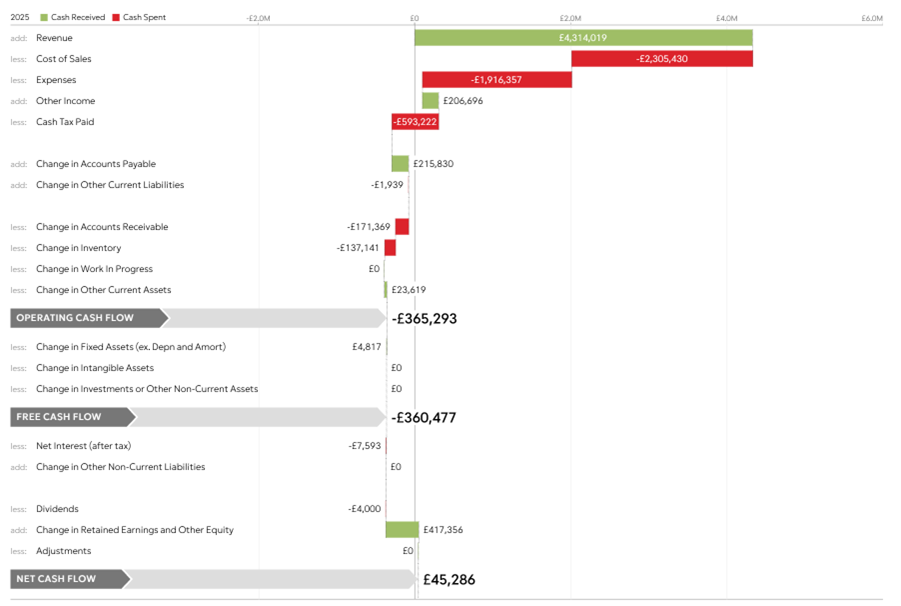
Cash flow is the life blood of all businesses. It is driven from a number of key elements that need to be managed interconnectedly to create a sustainable cash flow stream.
Equally important, a company’s ability to service its debt funding obligations – or its potential to deliver a return to providers of equity capital – must be monitored.
Cash flow forecasting and funding metrics include:
Learn about Fathom’s cash flow tool ->
Every business has a liquidity cycle that is naturally developed from operating activities. The common cycle is based on conversion and transformation processes.
In other words, cash is transformed into inventory, which – when sold – converts to accounts receivable, and then finally back to cash after meeting trade credit obligations.
The relationship between data such as the metrics below becomes an integral part of the liquidity cycle.

Return on investment (ROI) metrics combine multiple input and output metrics to show how efficiently and effectively a company generates its profit from the operating capital invested in the business.
They can be complex, as they require a clear understanding of various underlying data points; however, when calculated properly, they offer a powerful picture of a company’s profitability that can be benchmarked against other businesses in an accurate and meaningful manner.
They are also commonly used to develop strategic financial management pathways.
ROI metrics include:
Non-financial business data are any metrics that provide insights into a company’s strategic and operational performance as a correlated driver of profit, cash or value.
They are often harder to collate and report on than financial measures, but the effort taken is well worth it when it comes to interpreting your financial health check report.
Learn how to import non-financial data into Fathom and create non-financial KPIs ->
Here are some useful non-financial business data examples.
Metrics for operational performance should focus on measuring a company’s day-to-day operations and processes. This might include activities and areas such as:
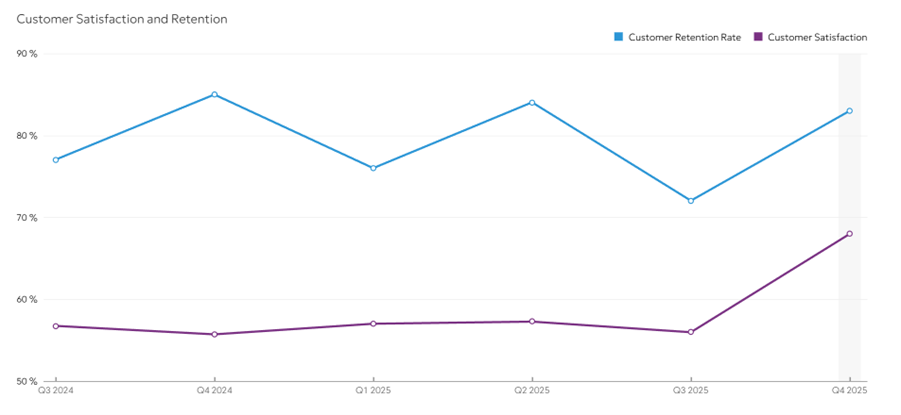
Metrics for customer satisfaction should gauge a company’s relationship with its customers and how happy they are with a product or service. They might include:
It is also important to assess metrics such as the performance, engagement and wellbeing of employees. Common metrics are:
To have confidence in your outcomes, it is essential to validate your input data.
Review all input data used to populate your model for quality and best practice. You must be satisfied that the accounting function is reliable.
Accounting records should be up to date with consistent rules governing data entry. Ideally, user-friendly and cost-effective accounting software such as Quickbooks, Xero or MYOB will have been used to produce high-quality data.
You also need a high level of confidence in matching the income and expenditure, as displayed on the income statement. Detailed elements supporting the classification of assets, liabilities and equity in the balance sheet should be carefully examined.
Normalising data is important because it brings different scales of data into a consistent format so that comparisons are meaningful. Without these adjustments, analysis, trends and ratios can be distorted in your financial health check.
There are 2 main types of data that you may need to normalise:
Once you have created your report, you will need to know how to understand and use the information.
Learn more in André’s next article: How to interpret a financial health check.
Discover how Fathom can help you create your financial health check and confidently own your future.
Start a free trial. No credit card required. Connect your accounting platform in minutes and start delivering the insights that strengthen every client relationship.

André Van Zyl FCA is a recognized authority in enterprise value creation. A Fellow of Chartered Accountants Australia and New Zealand, André brings decades of experience shaping business strategy and financial performance. He is the founding director of a leading business consultancy, a former partner and principal at top-tier accounting firms, and serves on advisory boards for companies across Australia. His insights draw on a rare blend of technical expertise and practical leadership. André is also the author of Business Beyond Survival (2024), a definitive guide to building resilient, growth-focused businesses.

