Multi-entity reporting breaks when you scale. Here's why manual consolidation fails and how to automate it for accuracy, speed, and sanity.
See all
Compare Fathom vs Qvinci to find the best reporting, forecasting, and consolidation software for your business or accounting firm.
How HiSmile's finance team moved from manual Excel consolidation to automated multi-entity reporting — and stayed lean while scaling globally.
Learn how UK practice, Ginger Bucks, uses Fathom Portfolio to manage 9 FreeAgent clients profitably with quarterly reporting, at just £5 per client. See the scalable model for MTD compliance.
How Nexist uses Fathom to answer the one question every small business owner is really asking: where is my money?
Your management report isn't being read the way you think. Here's how to design reports structured around how executives actually consume information.
Explore how AI is changing financial reporting, from faster insights to real risks. Learn use cases, tools, and how to implement it with confidence in 2026.
Payday Super starts 1 July 2026. Learn how businesses can manage cash flow, streamline reporting, and stay compliant with every pay cycle.
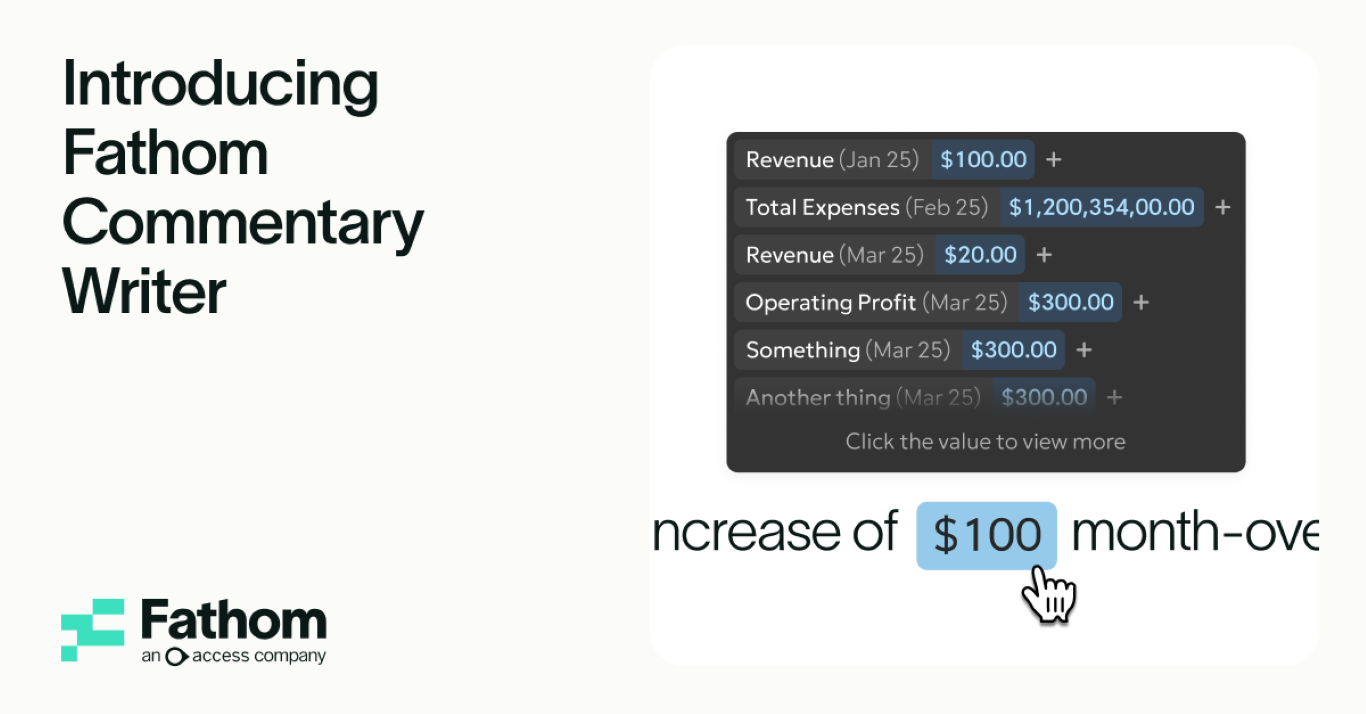
Our biggest product AI release is here. Commentary Writer. AI built for financial reporting that understands your business and shows its work.


.png)