
Summary
This report is designed to help advisory teams move beyond the numbers. Built in Fathom, it gives clients a clear picture of their performance through executive summaries, dynamic KPIs, and visual insights, while being scalable enough to roll out across a growing client base. Patrick Ball’s team at Aprio uses this format to create reports that guide better conversations, faster decisions, and stronger business outcomes.
What’s included:
- A tailored advisory report that combines financial outcomes with client-specific insights.
- Executive summary and key trends.
- High-level overview of financials with visual charts.
- KPI dashboards focused on what matters most to each client.
Why it’s effective
- Gives clients clarity and confidence by focusing on their priorities, without overwhelming the client with raw data.
- Replaces generic reports with conversations driven by context and relevance.
- Designed to be scalable across clients and advisory teams.
Designed for
- Accountants, advisors, and firms scaling advisory services.
- Teams that want to move beyond compliance and into value-driven conversations.
How to create this report in Fathom
1. Set up a custom template in Fathom
Create a new report template to serve as a consistent structure across your advisory clients. Aprio’s team leads with an executive summary that highlights key trends and health indicators, so begin by configuring this page using Observations to flag areas that need attention.
2. Include narrative and context
Design a report template in Fathom that balances high-level summaries with deeper insights. Patrick’s team structures their layouts around the metrics that matter most to each client, combining executive-level overviews with focused financial analysis.
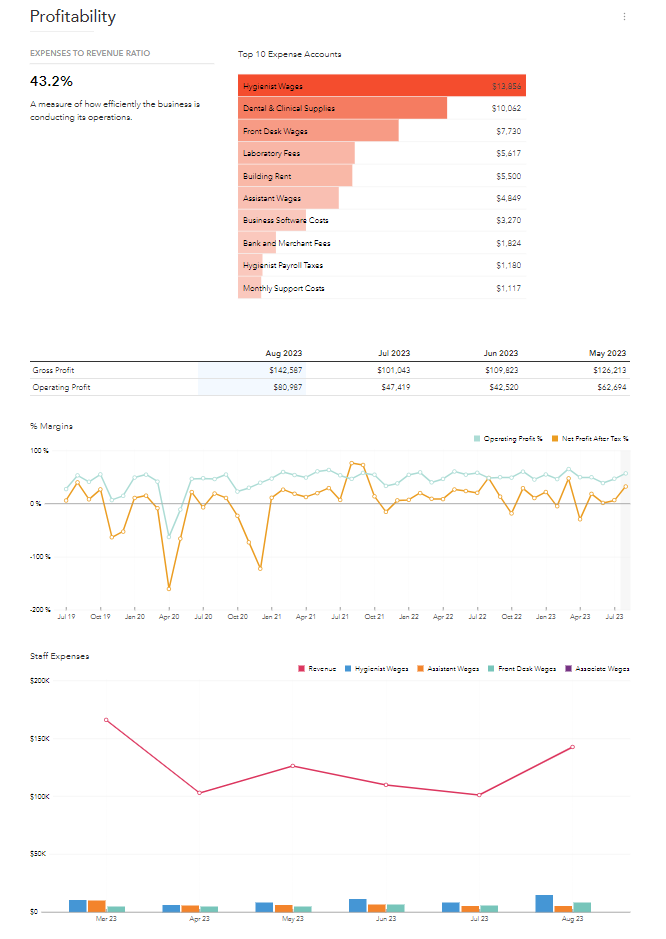
For example, this step could include:
- Visuals for gross and operating profit
- Top 10 expense accounts to surface cost drivers
- Staff-related KPIs (e.g. compensation as a % of revenue)
- Period-over-period comparisons to track improvement
- Narrative observations and plain-English commentary
Use Fathom’s layout tools to group related KPIs, visualise performance, and turn data into conversation starters. This section helps clients move from “what happened” to “what does it mean” and “what should we do next.”
3. Add customised KPI tracking
Create and tailor KPIs that reflect the goals and financial drivers of each client. Aprio focuses on building industry KPIs that support strategic conversations, not just compliance. Include targets where relevant and use colour indicators (green, amber, red) to communicate performance clearly.
4. Use side-by-side or trend visuals
Utilise charts and comparison tables to show trends over time or compare entities, periods, or metrics. The team at Aprio frequently includes:
- YoY or MoM comparisons
- Actuals vs budget or actuals plus forecast projection
- Department or business unit performance
5. Automate and scale
Once the layout and KPIs are set, save the structure as a reusable template. This allows your team to roll out the same impactful format across multiple clients, updating only the data and client-specific insight each time.
6. Present in-browser for dynamic conversations
Aprio prefers delivering reports live in-browser, using Fathom’s interactive features to walk clients through the story behind the numbers and drive more collaborative, strategic discussions.
Customer spotlight
Patrick Ball, Technology Advisory Director at Aprio
Patrick Ball is the Technology Advisory Director at Aprio, one of the fastest-growing accounting and business advisory firms in the U.S. With a background in business strategy and client advisory, Patrick is focused on making reporting more actionable. At Aprio, he leads efforts to scale advisory services across the firm by embedding clarity and context into every report.
“The numbers alone don’t move the needle, what matters is what the client does next. That’s what this report is designed to support.”